Spatial atlas of diabetic kidney disease reveals a B cell-rich subgroup
Nature • • health
Key Points:
- The study was approved by the University of Pennsylvania IRB and the TRIDENT Steering Committee, with informed consent obtained; leftover de-identified kidney samples were exempt from IRB review, and an external broker managed clinical data without personal identifiers.
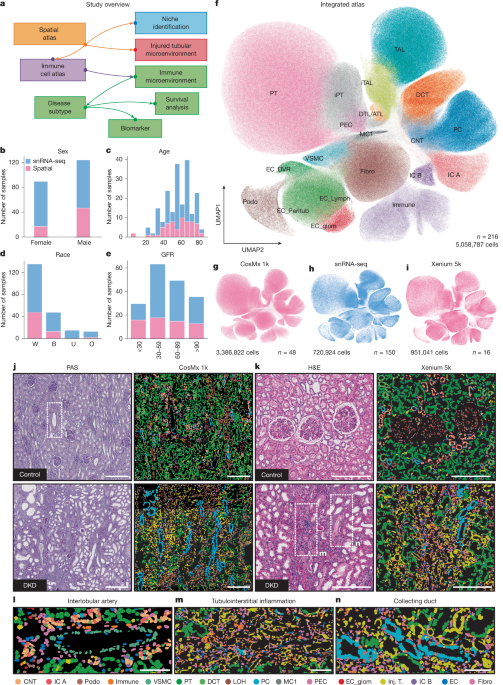
- Spatial transcriptomic data from human kidney tissue were generated using NanoString CosMx and 10X Genomics Xenium platforms, with custom gene probe panels, and integrated with single-nucleus RNA sequencing (snRNA-seq) data via deep generative models (scVI/scANVI) for unified cell-type annotation and spatial mapping.
- Advanced computational analyses including neighborhood quantification, covariance environment (COVET), Hotspot, and NicheCompass were employed to define spatially resolved kidney niches, injured tubular and immune microenvironments, and gene co-expression programs associated with diabetic kidney disease (DKD).
- Immune cell atlases and B cell subtype characterizations were generated by integrating spatial transcriptomics with snRNA-seq data using scVI/scANVI frameworks, enabling refined cell-type annotation and identification of disease-associated immune microenvironments.
- Proteomic and bulk RNA-seq analyses, pathway enrichment, ligand–receptor interaction inference, and validation in external cohorts (TRIDENT and UK Biobank) were performed to correlate spatial transcriptomic findings with kidney function, disease progression, and immune complex interactions, supported by rigorous statistical methods and reproducibility measures.


